Reporter
Turbocharge your analytics reporting
This is for you if:
- You want to know why what happened, happened, and what exactly it happened to.
- You want to know who to praise and who to sigh, disappointedly at.
- You want a life with less spreadsheet, and more fun stuff.
We will:
- Plug your various data sources into our lovely Deviance data engine.
- Automatically sort through the stuff that's happened, and show root causes of any changes.
- Present them in achingly beautiful reports that you will enjoy just looking at.
Call us on +44 (0)330 223 1164
Email us at info@taxonomics.co.uk
 Spend less time trying to beat useful information out of your analytics package. Spot the root causes behind year on year changes. See performance by user goal, across channels. Or what about getting some sensible numbers about PPC performance? Gross Profit on Advertising Spend will paint a very different picture than stupid ol’ ROAS (Return on Advertising Spend). Again, combines very nicely with our Deviant service.
The problem
Pulling cost and performance data together for web performance reporting can be time consuming and tedious… and in particular, reporting movements of customers between acquisition channels can be very difficult, as can including cost of goods data to reveal gross profit. This tends to mean that you focus on revenue against spend, and report primarily by channel instead of by user goal. Basing spending decisions on turnover rather than profitability can waste serious amounts of money… as can missing movements of visitors between channels.
How we can help
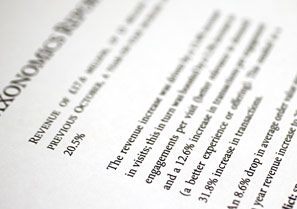
Our Reporter service produces weekly, monthly and quarterly reports showing how demand (and revenue, and gross profit) for specific categories and products changes through time—typically year-on-year. Reporter shows you what just changed, what demand and channel components drove the changes (‘root causes’), and what this did to revenue, channel costs and gross profit.
Reporter combines beautifully with our Deviant service, allowing you to show what just happened, and spot the most valuable things you could do next. Looking backwards and forwards.
How it works
Reporter reads data from your business information systems (such as cost-of-goods data), visit, transaction and product basket data from Google Analytics, GWT accounts, and cost and quality data from AdWords accounts, and munges it all together in an enormous database. This allows us to look at multiple revenue attribution models, cost data and cost-of-goods all at the same time. This can then spit out lovely visualisations of what’s going on, or make it available as raw data to pull into excel, or your own business information systems.
Look who've used our services